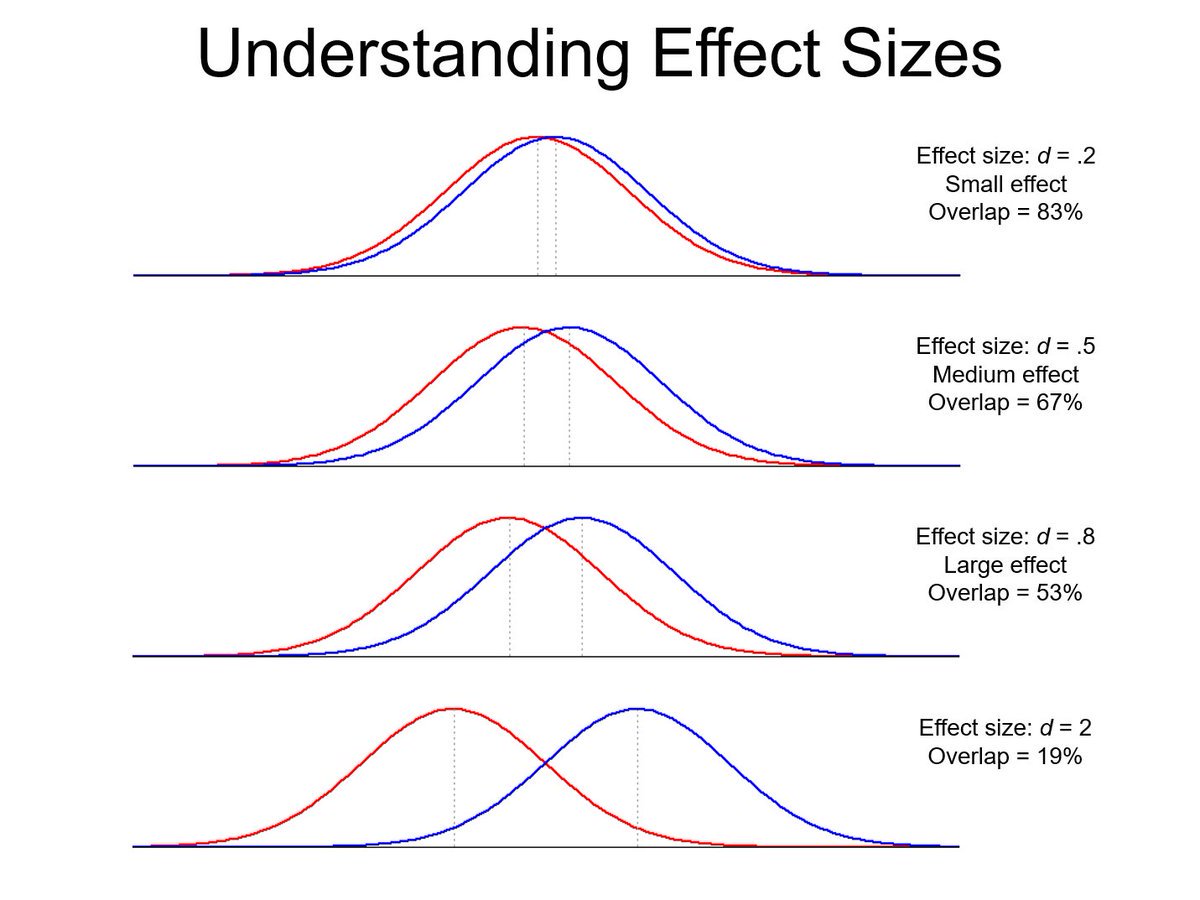
A picture which should be shown to every student in social science.
When an article says something like
"people in this category have a *significantly* higher level of X" with an effect size of 0.1 standard deviation, the effect is half as small as the one in the top picture.
It is interesting to think about all those experiments where we compare running times, or precision, or space efficiency between different methods among different queries.
For instance, I've often compared average or median running time across 100 random queries with *method A* vs. *method B*., but what would mean comparing effect size in this way?