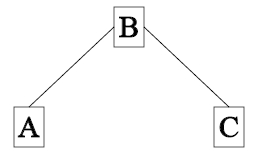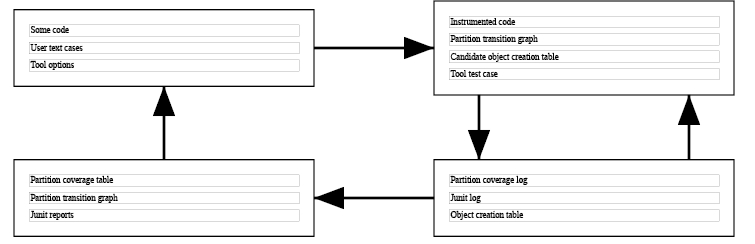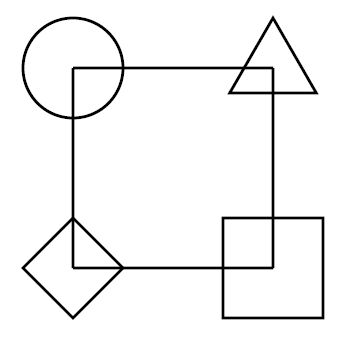
Figure 1: Four geometric forms connected by straight lines
Keywords: Graph drawing, Graph animation, SVG extensions, Functional programming
Biography
Kurt Nørmark has worked with XML technologies in the scope of functional programming languages. This includes various versions of HTML, SVG, as well as application-specific XML languages. The general interests of Kurt Nørmark are programming languages and program development tools.
This paper describes an extension of SVG that supports the drawing of graphs in terms of nodes and edges in between nodes. The graph drawing primitives support a variety of different node shapes, edge connection points, and edges. Both nodes and edges can be labeled. Two or more nodes can be aggregated as a single node, and an entire graph can be embedded in a single node. In addition, a number of different graph animations are described. The starting point of the SVG extension is a library that provides an exact of mirror of SVG 1.1 in the functional programming language Scheme. Each element of SVG 1.1 is represented as a specific function in Scheme. The graph drawing primitives are implemented as functional abstractions on top of the SVG 1.1 mirror functions. It is argued that the SVG extension approach, as exemplified by the graph drawing facilities, is useful whenever an author wishes to control the complexity of non-trivial SVG documents.
1. Introduction
2. The SVG Extension Mechanism
3. Graph Primitives
4. Animated Graphs
5. Conclusions
Appendix 1. Some supporting functions
Bibliography
This paper describes an application of SVG for drawing of graphs, and for doing simple animations of graphs. In the context of this paper a graph is a set of nodes together with a set of edges. We use the SVG graph application for production of illustrations in web-based, technical teaching materials. It is our experience that a large subset of illustrations in such materials can be represented as graphs - maybe in some loose or extended meaning. The teaching material is both authored and delivered in XML languages. The use of SVG instead of bitmapped images allows for scalable contents. In addition, the use of SVG makes it possible to stay entirely within the framework of XML, both in the source language and the target language of the materials.
There is a gap between the drawing primitives of SVG and the desired graph drawing primitives. In this paper we will illustrate one particular way to fill this gap. We define a graph drawing language that acts as a smooth and gentle extension of SVG. Via use of a functional programming language the high-level graph concepts are translated to their lower-level SVG counterparts. In Chapter 2 we introduce the SVG extension approach. Based on this, we describe the SVG graph drawing facilities in Chapter 3. In Chapter 4 we describe a facility for graph animation on top of the basic graph drawing primitives. The conclusions are drawn in Chapter 5.
There are three different contributions of this work:
It is worth pointing out that our work is not about XML representation of graphs; we focus on graph drawing. In addition, our work is not about automatic layout of graphs. The current version of the software requires explicit positioning of each node in the graph.
We will briefly mention related work on XML graph representation and graph drawing that is related to the use of SVG. GraphML [Brandes-et-al-2002] and GXL [Winter-et-al-2002] are XML formats for graphs. SVG has been used for graph drawing on top of both GraphML and GXL. GDL is a graph format of the commercial system aiSee (http://www.aisee.com/gdl/), which is able to generate SVG drawings of graphs. Similarly, GraphViz [Gansner-2000] is a graph visualization tool that is able to generate SVG output.
Several different kinds of graph animations are represented in the literature. A main branch is covered by algorithm animation [Stasko-1990]. In the "Graph Animation" project, Diehl et al. [Gork-2004] can visualize a sequence of graphs to which nodes and edges are added or deleted. SVG is used in the Graph Animation project to visualize graph evolutions. The aiSee system mentioned above is able, in SVG, to animate the transitions between different layouts of a given graph. The work described in the current paper deals with step-by-step presentation of nodes and edges in a single graph, as well as visualization of different kinds of "graph walk through".
All graphs that are used as illustrations in this paper are available, both as complete Scheme source files and as SVG files, via the URL http://www.cs.aau.dk/~normark/svg-graphs.html.
The SVG extension mechanism is based on a general mechanism for extending an XML language. The basic idea is to author an SVG document as an expression in a functional programming language, which returns an SVG value. In our work we use the Scheme programming language [Kelsey-et-al-1998]. The SVG fragment
  <svg width="800" height="800">
   <g>
    <circle cx="100" cy="100" r="50" stroke="black" stroke-width="3px"
            fill="none" />
    <polygon points="256.7,125,  300,50,  343.3,125" stroke="black"
             stroke-width="3px" fill="none" />
    <polygon points="50,300,  100,250,  150,300,  100,350" stroke="black"
             stroke-width="3px" fill="none" />
    <rect x="250" y="250" width="100" height="100" stroke="black"
          stroke-width="3px" fill="none" />
    <line x1="100" y1="100" x2="300" y2="100" stroke="black"
          stroke-width="3px" />
    <line x1="300" y1="100" x2="300" y2="300" stroke="black"
          stroke-width="3px" />
    <line x1="300" y1="300" x2="100" y2="300" stroke="black"
          stroke-width="3px" />
    <line x1="100" y1="300" x2="100" y2="100" stroke="black"
          stroke-width="3px" />
   </g>
  </svg>
corresponds to the following expression in Scheme
  (svg 'width "800" 'height "800"
   (g
     (circle 'cx 100 'cy 100 'r 50 'stroke "black" 'stroke-width "3px"
             'fill "none")
     (polygon 'points "256.7,125,  300,50,  343.3,125" 'stroke "black"
              'stroke-width "3px" 'fill "none")
     (polygon 'points "50,300,  100,250,  150,300,  100,350"
              'stroke "black" 'stroke-width "3px" 'fill "none")
     (rect 'x 250 'y 250 'width 100 'height 100 'stroke "black"
              'stroke-width "3px" 'fill "none")
     (line 'x1 100 'y1 100  'x2 300 'y2 100 'stroke "black" 'stroke-width "3px")
     (line 'x1 300 'y1 100  'x2 300 'y2 300 'stroke "black" 'stroke-width "3px")
     (line 'x1 300 'y1 300 'x2 100 'y2 300 'stroke "black" 'stroke-width  "3px")
     (line 'x1 100 'y1 300 'x2 100 'y2 100 'stroke "black" 'stroke-width "3px"))
  )
Both of these create the geometric forms shown in Figure 1.
For each element in SVG there is a corresponding mirror function in Scheme [Normark-2005]. The name of the mirror function is the same as the name of the SVG element. When a Scheme mirror function is called it generates an intermediate tree structure (akin to an abstract syntax tree) which in a straightforward way can be transformed to SVG. Moreover, the Scheme function encapsulates detailed knowledge of the SVG element in terms of legal attributes and legal, immediate document constituents. This knowledge is used to guarantee that the resulting SVG value of the expression is valid relative to the SVG DTD. The set of Scheme mirror functions corresponding to SVG 1.1 is generated automatically from an SVG 1.1 DTD by use of tools in the LAML tool suite [Normark-2006].
There are only lexical differences between an SVG fragment and the similar expression in Scheme (as illustrated above). In the Scheme expression, SVG element instances are represented by function calls. Attribute names are represented as Scheme symbols, and attribute values can be either strings or numbers. The advantages of the Scheme expressions over the SVG fragments are substantial:
For a concrete illustration of these advantages, the Scheme source of the SVG fragment shown above can be rewritten as
  (svg 'width "800" 'height "800"
   (let ((x1 100) (y1 100)   (x2 300) (y2 300)  (r 50)
         (line-props (list 'stroke "black" 'stroke-width "3px")) )
    (g
     (circle 'cx x1 'cy y1 'r r line-props 'fill "none")
     (equilateral-triangle 'cx x2 'cy y1 'r r line-props)
     (diamond 'cx x1 'cy y2 'r r line-props)
     (rect 'x (- x2 r) 'y (- y2 r) 'width (* 2 r) 'height (* 2 r) line-props
           'fill "none")
     (line 'x1 x1 'y1 y1  'x2 x2 'y2 y1 line-props)
     (line 'x1 x2 'y1 y1  'x2 x2 'y2 y2 line-props)
     (line 'x1 x2 'y1 y2 'x2 x1 'y2 y2 line-props)
     (line 'x1 x1 'y1 y2 'x2 x1 'y2 y1 line-props) )))
This expression still produces the drawing shown in
Figure 1.
The functions
equilateral-triangle
and
diamond
have been implemented for demonstration purposes. Their implementations are shown in
Appendix 1.
The use of these abstractions raises the level of abstraction of the SVG document.
The new abstractions enjoy the same status as the existing, pre-defined
elements of SVG (such as
circle
and
rect). As another aspect that improves the document, the local name bindings
of the coordinates
x1,
y1,
x2,
y2,
as well as the radius
r
makes the SVG document fragment much easier to maintain. The collection of attributes,
bound to
line-props,
makes it convenient to handle a set of standard attributes that are passed to a
number of different SVG elements. The list of attributes is automatically unfolded
by the receiving SVG mirror functions in Scheme. Finally, expressions
such as the arithmetic expressions
(- x2 r)
and
(* 2 r)
can be used directly in place of attribute constants.
The two new functions can be seen as domain-specific SVG extensions, supplied by the
author of the document. In our case, the domain happens to be graph
drawing, but the ideas can be used in general. The two functions correspond
to new SVG elements that accept attributes and element content. Thus,
all the parameters of the two functions correspond to attributes or element contents.
In order to gain additional flexibility we will also allow functional abstractions
that mix traditional, positional parameter passing, and passing of attributes
and element content. As an example, the
diamond
function from above could be rewritten to accept the x and y coordinates as traditional,
positional parameters before the attributes:
(diamond 100 200 'r 50 'stroke "black")When we in Chapter 3 deal with a representation of graphs, it turns out that the mixed parameter passing mode is convenient.
It is worth noticing that some of the advantages mentioned above can be achieved by
other means as well. SVG already supports simple abstractions (in
defs
elements) and applications of these (in
use
elements). The passing of attribute lists (such as
line-props)
can in some situations be dealt with by means CSS classes and separate
CSS parts or files. In addition, some SVG elements (such as
mpath)
provides for sharing of some attributes by means of the xlink attribute
href.
We will now use the extension mechanisms described in Chapter 2 for definition of a vocabulary that extends SVG with elements for graph drawing. The following example illustrates the basic idea.
  (let* ((x1 100) (x2 (+ x1 100)) (x3 (+ x2 100))
         (y1 100) (y2 (+ y1 100))
         (stroke-props  (list 'stroke "black" 'stroke-width "1")))
    (let* ((node-a (svg-node rectangular x1 y2 "A"))
           (node-b (svg-node rectangular x2 y1 "B"))
           (node-c (svg-node rectangular x3 y2 "C"))
           (edge1 (svg-edge node-a "ct" node-b "lc" stroke-props))
           (edge2 (svg-edge node-b "rc" node-c "ct" stroke-props)))
      (svg-graph (list node-a node-b node-c) (list edge1 edge2) )))
The resulting graph is shown in Figure 2.
The outer
let*
name binding defines a grid of coordinates and some stroke properties. The inner name
binding defines three nodes and two edges bound to the names
node-a,
node-b,
node-c,
edge1,
and
edge2
respectively. The nodes are positioned absolutely with use of the coordinates from
the outer name binding construct. A directed edge is, in a natural way,
defined by means of direct references to two given nodes.
Two connectors (corresponding to ports in GraphML) associated with each
edge, tell where the edge is connected to the source node and the target
node.
The function
svg-node
requires three positional parameters, namely the shape function (see below) and the
x and y coordinates of the center of the node. The function
svg-edge
requires four positional parameters, namely the two nodes that it connects and the
corresponding connectors. The function
svg-graph
accepts a list of nodes and a list of edges as element contents, and it returns the
actual rendering of the graph in terms of an SVG group (g)
of
rect
and
path
fragments. The element contents of
svg-node
and
svg-edge
is used as node labels and edge labels respectively. Both
svg-node
and
svg-edge
accept a large set of XML attributes. Some of these attributes are related to the
graph concepts, and others represent graphical properties that are directly
relayed to the SVG elements that implement the graph concepts.
A connector is a string "hv" of length two, which describes a horizontal and vertical connection point. h is either 'l', 'c', or 'r' (for left, center, and right respectively). v is either 't', 'c', or 'b' (for top, center, and bottom respectively). As such, a given connector provides for nine possible edge connector points for a node.
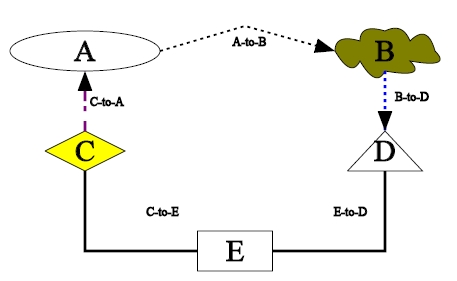
Figure 3 shows another graph, which is created by the following expression:
  (let* ((x1 100) (x2 (+ x1 150)) (x3 (+ x2 150))
         (y1 100) (y2 (+ y1 100)) (y3 (+ y2 100)) )
   (let* ((node-a (svg-node circular x1 y1 "A" 'min-width 150))
          (node-b (svg-node cloud x3 y1 "B" 'bg-color "olive" 'min-width 100))
          (node-c (svg-node diamond x1 y2 "C" 'bg-color "yellow"
                            'min-width "80"))
          (node-d (svg-node triangular x3 y2 "D" 'min-width 75))
          (node-e (svg-node rectangular x2 y3 "E" 'min-width 75))
          (edge1 (svg-edge node-a "rc" node-b "lc" 'break-path "l 85 -25"
                    'arrow "yes" 'font-size "12" 'ldx -15 'ldy -5 "A-to-B" ))
          (edge2 (svg-edge node-b "cb" node-d "ct"
                    'arrow "yes" 'font-size "12" 'ldx 10 "B-to-D"))
          (edge3 (svg-edge node-c "ct" node-a "cb" 'arrow "yes" 'font-size "12"
                    'ldx 5 'ldy 5 "C-to-A" ))
          (edge4 (svg-edge node-c "cb" node-e "lc" 'style "vh" 'font-size "12"
                    'ldx 5 'ldy 5 "C-to-E" ))
          (edge5 (svg-edge node-e "rc" node-d "cb" 'style "hv" 'font-size "12"
                    'ldx 5 'ldy 5 "E-to-D" )) )
    (svg-graph
      (list node-a node-b node-c node-d node-e)
      (list edge1 edge2 edge3 edge4 edge5) )))
The different node shapes are controlled by the
shape functions
(such as
circular,
cloud,
diamond,
triangular,
and
rectangular)
passed as the first parameter to
svg-node.
A shape function draws a closed path inside a given bounding box. In the simple cases
the edges are straight lines between given connectors of the source
and destination nodes. (C-to-A and B-to-D are examples of such edges).
It is, however, also possible to draw broken edges, either with horizontal/vertical
edge parts (used for C-to-E and E-to-D), or by explicitly giving an
edge break path
(used for A-to-B).
The
svg-edge
attributes
ldx
and
ldy
are used for (delta) adjustments of edge labels relative to their default, middle positions.
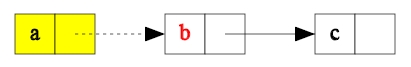
It is sometimes useful to draw graphs with composite nodes. As an example, consider the graph in Figure 4 which illustrates a graph with three two-component nodes.
The graph is produced by the expression:
  (let* ((x1 100) (x2 (+ x1 150)) (x3 (+ x2 150))
        (y1 100) )
   (let* ((c1 (cons-cell x1 y1 "a" 'bg-color "yellow"))
          (c2 (cons-cell x2 y1 "b" 'text-color "red"))
          (c3 (cons-cell x3 y1 "c"))
          (r1 (cons-ref c1 c2 "lc" 'stroke-dasharray "3 4" ))
          (r2 (cons-ref c2 c3 "lc")) )
      (svg-graph  (list c1 c2 c3) (list r1 r2) )))
The abstractions
cons-cell
and
cons-ref
are defined by the following Scheme functions:
  (define (cons-cell x y car-txt . attributes)
   (let* ((cell-width 40)
          (default-svg-node-attributes
            (list 'font-size 22 'min-height cell-width 'min-width cell-width)))
    (let ((car-box (svg-node rectangular x y car-txt 'id "head-cell"
                             attributes default-svg-node-attributes))
          (cdr-box (svg-node rectangular (+ x cell-width) y 'id "tail-cell"
                             attributes default-svg-node-attributes)))
     (g car-box cdr-box))))

  (define (cons-ref cell-1 cell-2 to-locator . attributes)
   (let* ((default-attributes (list 'stroke "black" 'arrow "yes")))
    (svg-edge cell-1 "cc" cell-2 to-locator 'from-id "tail-cell" 'to-id
              "head-cell" attributes default-attributes)))
The function
cons-cell
groups two rectangular
svg-nodes
(
car-box
and
cdr-box)
in an SVG
g
element. The function
cons-ref
represents an
svg-edge
from the center of the tail cell of
cell-1
to the
to-locator
of
cell-2.
The
from-id
and
to-id
attributes of
svg-edge
allows us to address a particular target node in the group of
svg-nodes
encapsulated by a
cons-cell.
As it is illustrated above, it is possible to pass attributes such as
bg-color,
text-color
and
stroke-dasharray
through the functions
cons-cell
and
cons-ref
to the underlying graph abstractions.
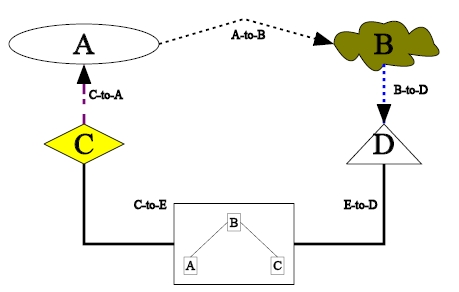
As a slightly more advanced aspect, we support graphs with nodes that embed another
graph (corresponding to nested graphs in GraphML). As an example,
Figure 5
shows a variant of the graph in
Figure 3
in which node E contains the graph in
Figure 2.
The graph in
Figure 5
is created by replacing
node-e
with the expression
(svg-composite-node x2 y3 first-graph 'padding 10 'width 100)
where
first-graph
refers to the SVG graph expression that creates the graph in
Figure 2.
The
padding
attribute allows us to specify some white space around the embedded graph,
and the
width
attribute specifies the width of the composite node.
Figure 6 shows another application of composite SVG nodes. In this example each of the four nodes consist of a number of boxes. In turn, each of the boxes is represented as a node in a graph without edges.
Let us now sum up with respect to the implemented graph primitives. Based on an initial situation where SVG is available as a library of mirror functions in Scheme we have implemented a set of new Scheme functions for graph drawing. Alternatively we could have established the graph drawing primitives as a new XML language (in the spirit of GraphML). Our current approach is preferable when we deal with minor SVG extensions, or when we work with extensions that have not yet found their final form.
The graph drawing functions deviate from the SVG mirror functions by allowing some attributes and/or constituents to appear as positional parameters. Instead of using Scheme functions with mixed parameter passing (positional as well XML parameter passing) it would, alternatively, be possible to reformulate the abstractions as pure XML abstractions, allowing only attributes and element contents. Such a reformulation of the graph drawing abstractions would be preferred if it should be used as the basis of a new and pure XML graph drawing language.
In addition to the basic graph drawing facilities described in
Chapter 3
our graph drawing functions also permit various graph animations. The
graph animations are specified at a much higher level than the native
SVG animations. The type of the graph animation is controlled by the form
with-animation,
which may surround an
svg-graph
form:
(with-animation animation-type some-graph)Graph nodes and graph edges can, in addition, be decorated with stepping attributes, which control the temporal animation order.
The animation type
step-buttons-reveal
makes the nodes and edges appear at given step-values, or within a given
step interval. This type of animation is useful when a graph is to be introduced
gradually, in a step-by-step fashion. The step control is managed by
a forward and a backward step button. To illustrate the idea, the following
outlines an animation of the simple graph in
Figure 2.
  (with-animation 'step-buttons-reveal
   (let* (...)
    (let* ((node-a (svg-node ... "A" 'step 1))
           (node-b (svg-node ... "B" 'step 2))
           (node-c (svg-node ...  "C" 'step 4))
           (edge1 (svg-edge node-a "ct" node-b "lc" ...
                            'step-from 3 'step-to 4))
           (edge2 (svg-edge node-b "rc" node-c "ct" ...
                            'step-from 4 'step-to 5)) )
       (svg-graph 'from-step 1 'to-step 5
             (list node-a node-b node-c)
             (list edge1 edge2)) )))
The
from-step
and
to-step
attributes of
svg-graph
define the start and end steps of the animation. Node A appears first
followed by node B. Next, at step 3, the edge between A and B appears. At step 4
node C appears together with the edge from B to C. In addition, the edge
from node A to node B disappears at this point in time. At step 5 the
edge from B to C disappears. Thus, at the end of the animation only
the graph nodes are left.
It is possible to accompany a graph animation with textual explanations of the individual
graph animation steps. This can be done by adding an
explanations
clause to the SVG graph. The
explanations
of the graph animation outlined above can be written as follows:
 (explanations 'x 10 'y 350 'width 380 'height 50 'font-size 18
   (explanation 'step 0 "The start situation.")
   (explanation 'step 1 "A appears")
   (explanation 'step 2 "B appears")
   (explanation 'step 3 "A and B are connected")
   (explanation 'step 4 "A and B are disconnected, C appears connected to B")
   (explanation 'step 5 "B and C are disconnected") )
The attributes of the
explanations
clause specify the location and font characteristics of the explanation text box.
The animation type
step-buttons-walk-through
highlights the nodes and edges at given step values. A node is highlighted
by applying a distinguished highlighting background color to it. An edge is highlighted
by applying a distinguished color as stroke color, in addition to making the edge
bolder. The highlighting appears at a given step, and disappears when
the next step is asked for. As suggested by the name, this type of animation
is useful when explaining or discussing a certain pattern of graph traversal.
Like above, the stepping is controlled by the generated step buttons. Via use of
the
steps
attribute it is possible to ask for highlighting of some node or edge
at several different steps. In contrast to the animation type
step-buttons-reveal,
the entire graph is shown from start to finish when
step-buttons-walk-through
is used.
The animation type
step-buttons-walk-through-edge-motion
is a variant of
step-buttons-walk-through.
Instead of highlighting the edge by means color and boldness, a token
is moved along edges from the source nodes to the target nodes as part
of a step transition.
We have presented a library of graph drawing functions that can be understood as an extension of SVG. The functions are used in a context where SVG is dealt with by means of a set of Scheme functions instead of by native XML elements. This is somehow similar to a situation where SVG is dealt with by means of an interactive authoring environment. In our context, the graph drawing functions in Scheme are seen as gentle extensions of SVG.
SVG can be used together with many different programming languages. Typically, SVG contents is embedded in imperative print statements, and typically the programming language dominates and shadows SVG. As such it is difficult to recognize the SVG contents in between the fragments of the programming language. The approach described in this paper is less intrusive because of the functional approach, and due to the similarities between XML notation and S-expressions written in Scheme.
As an important issue, the proposed graph drawing primitives are not fully
"XML compatible".
In the current version of the software we have chosen to use a mixture of traditional
Scheme parameter passing and XML attributes/element contents. This provides
for an elegant and natural representation of graphs. It would, however,
also be possible to provide versions of
svg-node
and
svg-edge
that eliminate the positional parameters. Such a solution would identify nodes
by means of
id
attributes. In case we wish to elevate the current set of graph drawing primitives
to a pure XML graph drawing language, this solution would be necessary.
The most substantial work on graph drawing is about automatic graph layout. In our
current work, we position the nodes explicitly, and we can specify edge
path shapes explicitly. It would be interesting to relax the requirement
of absolute node positioning and edge shaping. From an interface point of view, this
could be elegantly done by calling a graph layout function from function
svg-graph,
before rendering the graph in SVG. This has not yet been attempted.
Working with SVG in Scheme and LAML is seen as substantial improvement compared with
authoring of SVG contents in a text editor or in an XML editor. As pointed
out in the paper, the differences between an SVG fragment and the similar
Scheme expression are almost negligible. In both cases we deal with delimitation
of document fragments by means of parentheses, either
<e> ... </e>
or
(e ...),
and by means of attribute notation, either
a="v"
or
'a "v"
.
As demonstrated in the paper, the power of a flexible programming language
makes it easy to extend SVG in a given direction. Furthermore, the possibility of
smooth integration of arbitrary computations in an SVG document provides additional
power.
The graph library as well as the underlying related XML software, is free and open GPL licensed software available from the LAML web site [Normark-2006].
In this appendix we show implementations of the Scheme functions
equilateral-triangle
and
diamond.
We used these functions to produce the triangle and the diamond geometric
shapes of the second version of
Figure 1.
  (define equilateral-triangle
   (xml-in-laml-abstraction
     (lambda (c a)
      (let* ((cx (as-number (get-prop 'cx a)))
             (cy (as-number (get-prop 'cy a)))
             (r (as-number (get-prop 'r a)))
             (d (* (* 2 r) (sin (/ pi 3)))))
       (polygon 'points
         (point-list (- cx (/ d 2)) (+ cy (/ r 2))
                     cx (- cy r)
                     (+ cx (/ d 2)) (+ cy (/ r 2)))
         (property-subset a '(stroke stroke-width))
         'fill "none")))
     'non-passed-value
     "equilateral-triangle"
     'svg11))

  (define diamond
   (xml-in-laml-abstraction
     (lambda (c a)
      (let* ((cx (as-number (get-prop 'cx a)))
             (cy (as-number (get-prop 'cy a)))
             (r (as-number (get-prop 'r a))))
       (polygon 'points
         (point-list (- cx r) cy
                     cx (- cy r)
                     (+ cx r) cy
                     cx (+ cy r))
         (property-subset a '(stroke stroke-width)) 'fill "none")))
     'non-passed-value
     "diamond"
     'svg11))
In both functions, the application of
xml-in-laml-abstraction
arranges that the nested lambda expression is called on the element contents
c
and the attributes
a.
The
let*
constructs bind and calculates the geometric properties of the triangle
and the diamond. Both functions are implemented in terms of an SVG
polygon.
The function
point-list
(implementation not included) produces a comma-separated list of x, y
coordinates as required by the
points
attribute of
polygon.
XHTML rendition made possible by SchemaSoft's Document Interpreter™ technology.